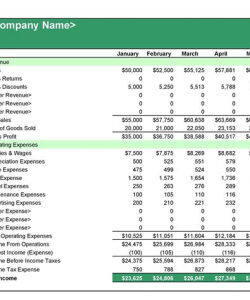
A vertical analysis income statement template is a financial document that presents an organization’s income and expenses for a specific period of time, typically a quarter or a year. It is vertically formatted, with each line item expressed as a percentage of a base amount, typically net sales or revenue. Vertical analysis is a useful tool for financial analysis and performance evaluation, as it allows analysts and investors to assess the company’s revenue streams and expense structure.
Vertical analysis can be performed on any income statement, but it is particularly useful for comparing a company’s financial performance over time or against industry benchmarks. By presenting each line item as a percentage of a common base, vertical analysis eliminates the effects of changes in the company’s overall size or revenue, allowing for more meaningful comparisons.
Understanding Vertical Analysis
To create a vertical analysis income statement template, simply divide each line item in the income statement by the base amount and multiply by 100. The resulting percentages represent the contribution of each line item to the base amount.
For example, if a company has net sales of $1 million and its cost of goods sold is $600,000, the cost of goods sold would be expressed as 60% on a vertical analysis income statement template. This indicates that 60% of the company’s net sales were used to cover the cost of goods sold.
Vertical analysis can be applied to any line item in the income statement, including revenue, expenses, and profits. By examining the percentage changes in these line items over time, analysts can identify trends and patterns that may indicate financial strengths or weaknesses.
Benefits of Vertical Analysis
- Eliminates the effects of size – Vertical analysis allows for meaningful comparisons of financial performance regardless of the size of the company.
- Identifies revenue streams – By analyzing the percentage contribution of each revenue stream to total revenue, companies can identify their most profitable products or services.
- Assesses expense structure – Vertical analysis can be used to assess a company’s expense structure and identify areas where costs may be excessive or inefficient.
- Monitors profitability – By analyzing the percentage of net income to total revenue, companies can monitor their overall profitability and identify trends in their profit margins.
Conclusion
A vertical analysis income statement template is a valuable tool for financial analysis and performance evaluation. It allows analysts and investors to understand a company’s revenue streams and expense structure, identify trends and patterns, and assess overall profitability. By presenting each line item as a percentage of a common base, vertical analysis eliminates the effects of changes in the company’s overall size or revenue, allowing for more meaningful comparisons.
Vertical analysis is a relatively simple technique that can provide valuable insights into a company’s financial performance. It is a useful tool for both internal and external users of financial statements, including managers, investors, and creditors.


